
Is there a function for that?
I tried to do this by overlaying a line series over a column chart, but it didn't work. The website states that we are able to do mixed charts types in one (a line graph mixed with a column). However, the example code is not helpful. Can anyone provide some guidance. I want a mixed chart where I can add a line series to a column chart.
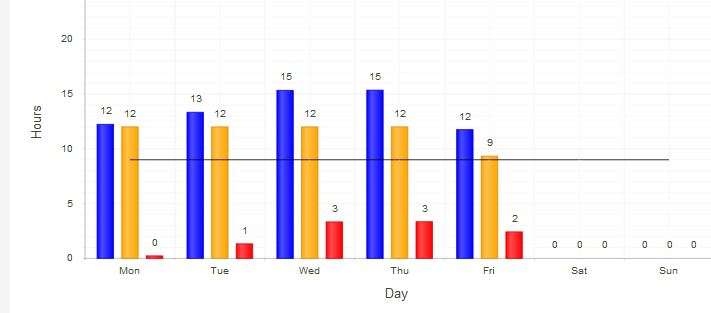
Update: Now it works. Here is a full code example if anyone has difficulties.
$chart1 = new KoolChart("chart1");
$chart1->scriptFolder=$KoolControlsFolder."/KoolChart";
$chart1->Transitions = false;
$chart1->Width = 900;
$chart1->BarGapRatio = 0.0;
$chart1->Title->Text = "activity Time per Day";
$chart1->PlotArea->XAxis->Title = "Day";
$chart1->PlotArea->XAxis->Set(array("Mon","Tue","Wed","Thu","Fri","Sat","Sun"));
chart1->PlotArea->XAxis->MinorStep = 0;
$chart1->PlotArea->YAxis->Title = "Hours";
$chart1->PlotArea->YAxis->LabelsAppearance->DataFormatString = "{0}";
$series = new ColumnSeries(); //total
$series->Name = "Operating Hrs";
$series->Appearance->BackgroundColor = "blue";
$series->ArrayData($btotal);
$series2 = new ColumnSeries(); //total
$series2->Name = "Production Hrs";
$series2->Appearance->BackgroundColor = "orange";
$series2->ArrayData($ctotal);
$series3 = new ColumnSeries(); //total
$series3->Name = "Est. Non-Production Hrs";
$series3->Appearance->BackgroundColor = "red";
$series3->ArrayData($dtotal);
$series4 = new LineSeries();
$series4->ArrayData(array(20,20,20,20,20,20.20));
$chart1->PlotArea->AddSeries($series4);
$chart1->PlotArea->AddSeries($series);
$chart1->PlotArea->AddSeries($series2);
$chart1->PlotArea->AddSeries($series3);
Where I am creating the arrays for the first 3 series pragmatically. If anyone knows of a better way to create a benchmark line, please let me know. this is not very elegant. (still having problems getting the two graphs to work correctly, but at least they are working.) Thanks.