
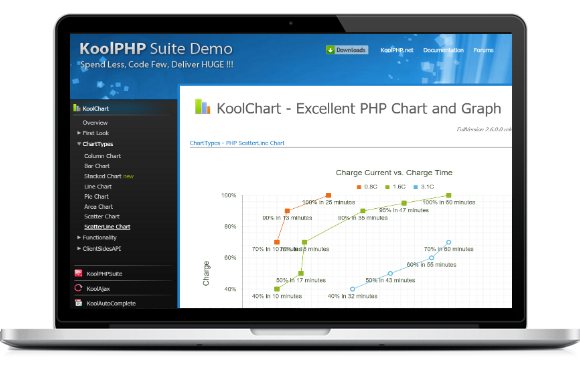
The Best [PHP Chart] you can find
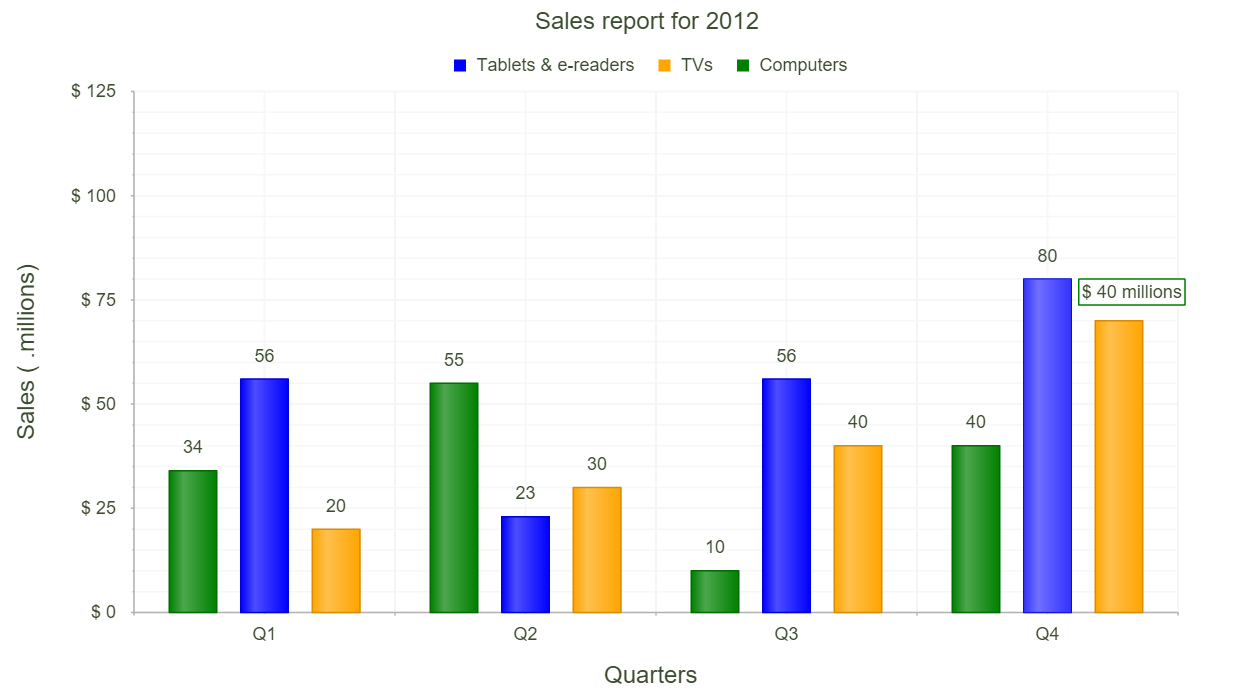
Use column chart when you need to compare two more more values. The bar is organized vertically. Column chart is used a lot in sale report.
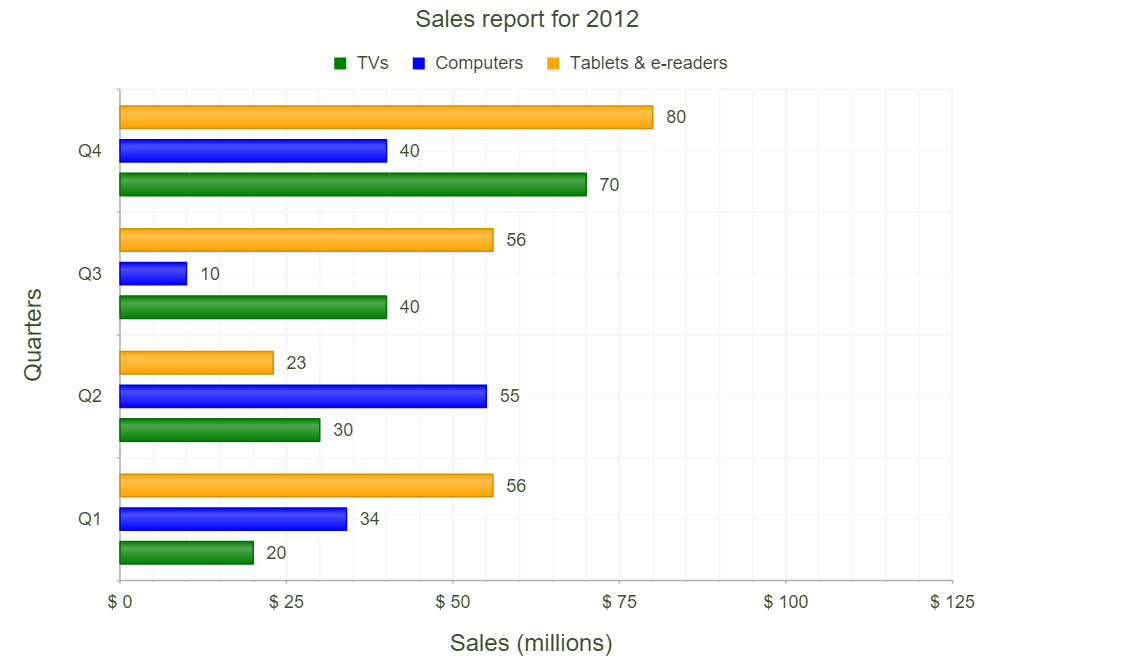
Similar to column chart, bar chart is also used to compare two or more values. However it is organized horizontally. Bar chart is good when you have long description for each series.
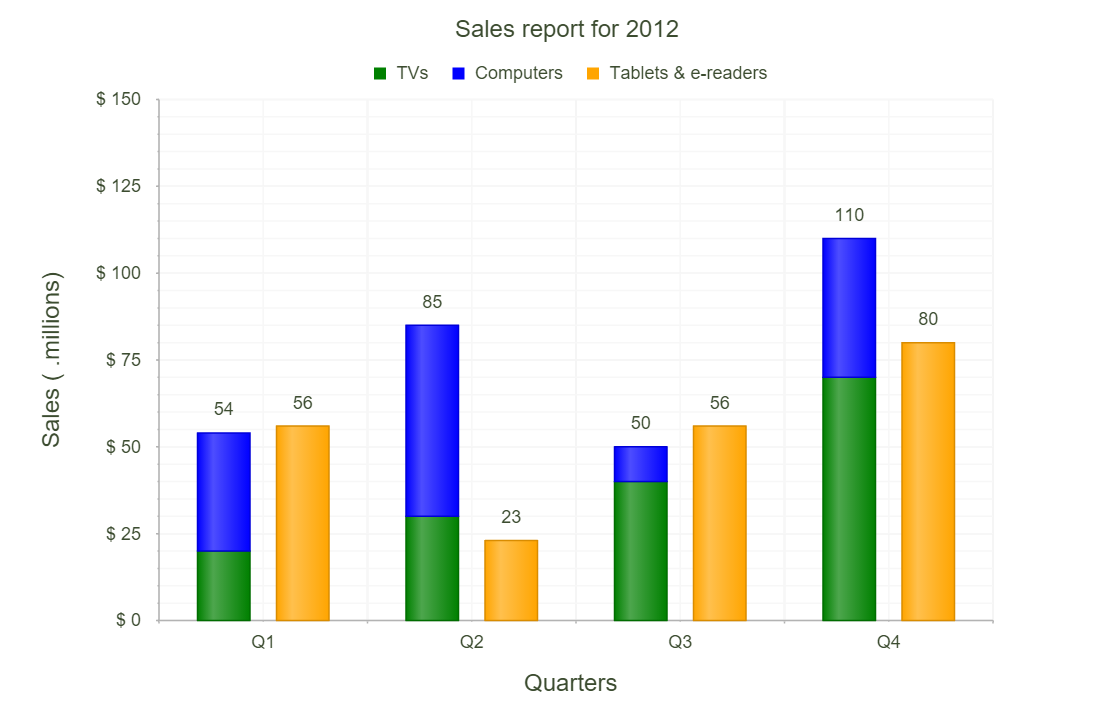
Use a stacked column chart when you have multiple groupings and you’re interested in the proportions between values in each grouping, as well as each grouping's total.
Use line graphs when you want to compare changes over the same period of time for more than one group. May be how your sales grow month after month.
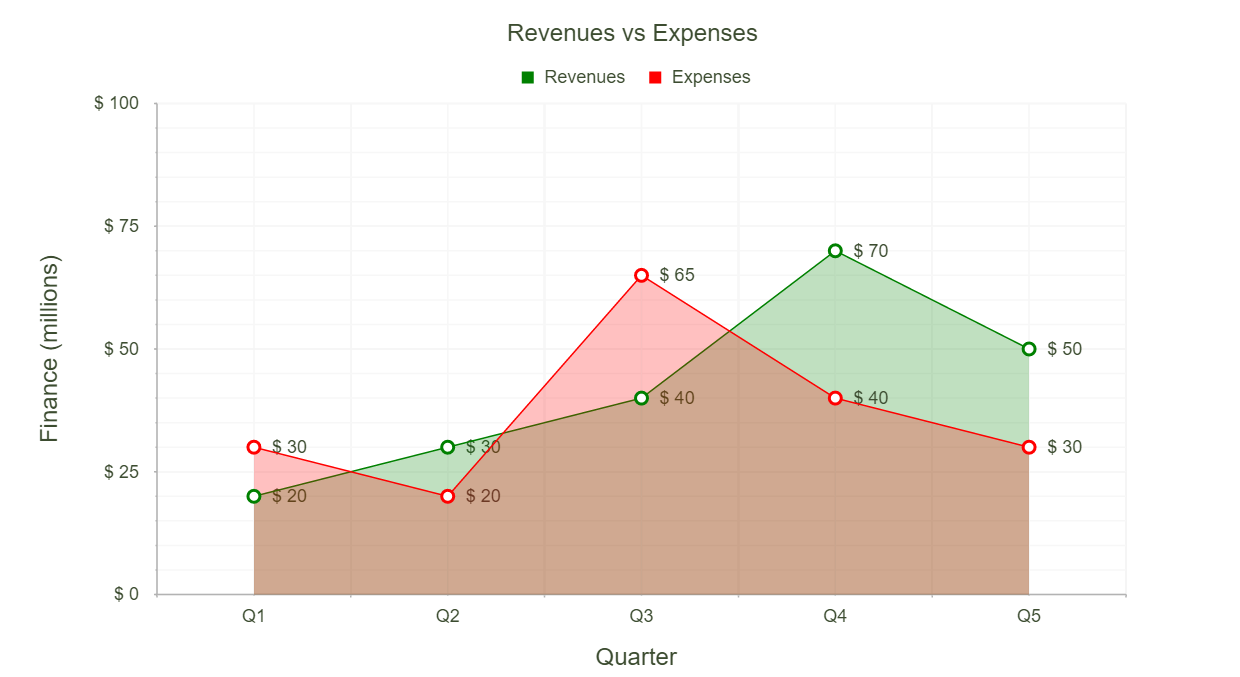
Use area chart for multiple data series with part to whole relationships, or for individual series representing a physically countable set, or cumulative series of values.
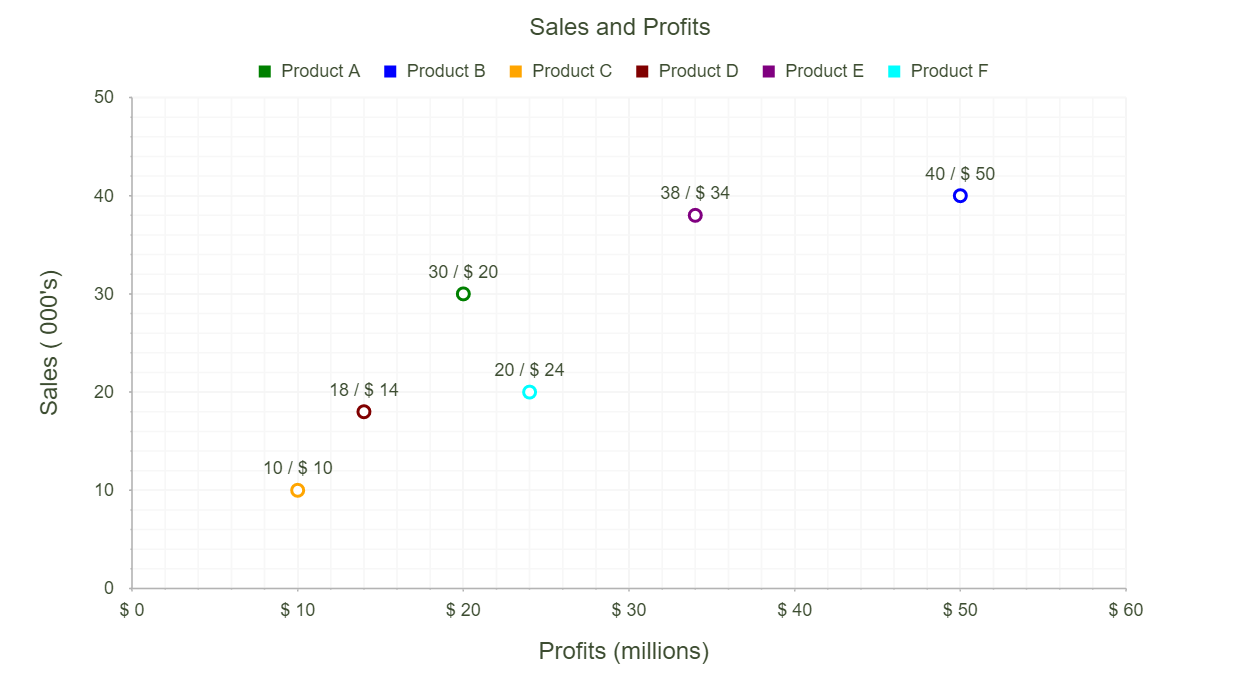
A scatter diagram is a tool for analyzing relationships between two variables. One variable is plotted on the horizontal axis and the other is plotted on the vertical axis. The pattern of their intersecting points can graphically show relationship patterns.
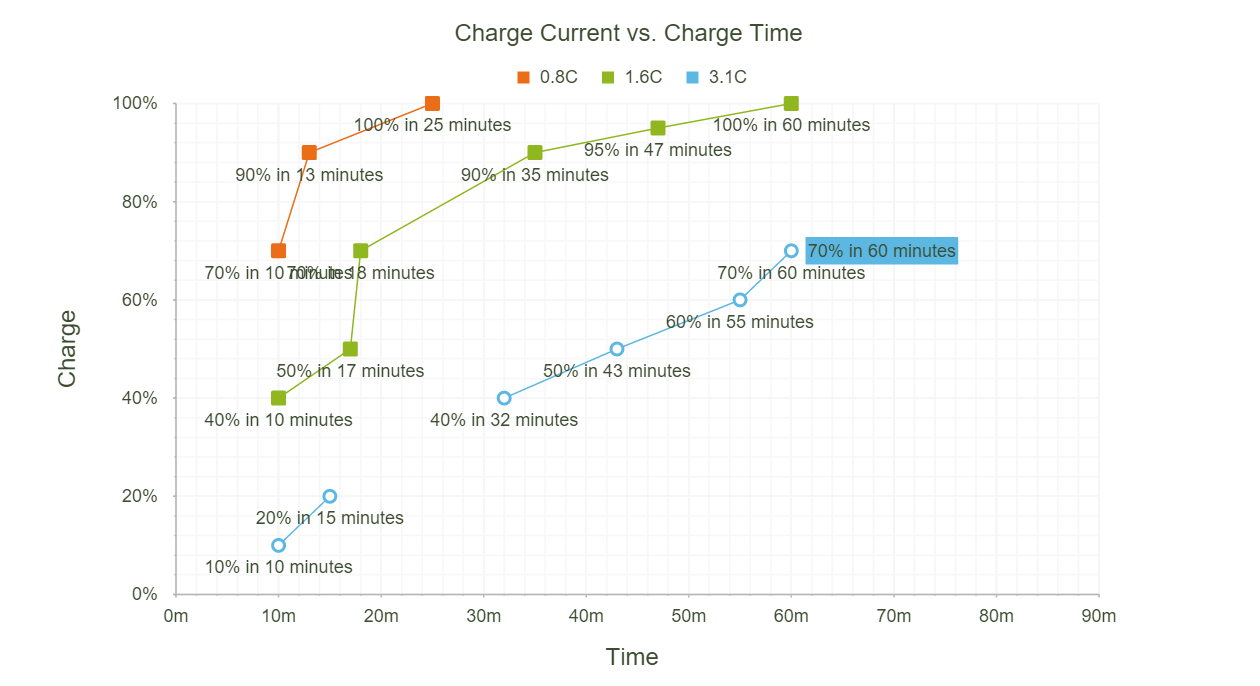
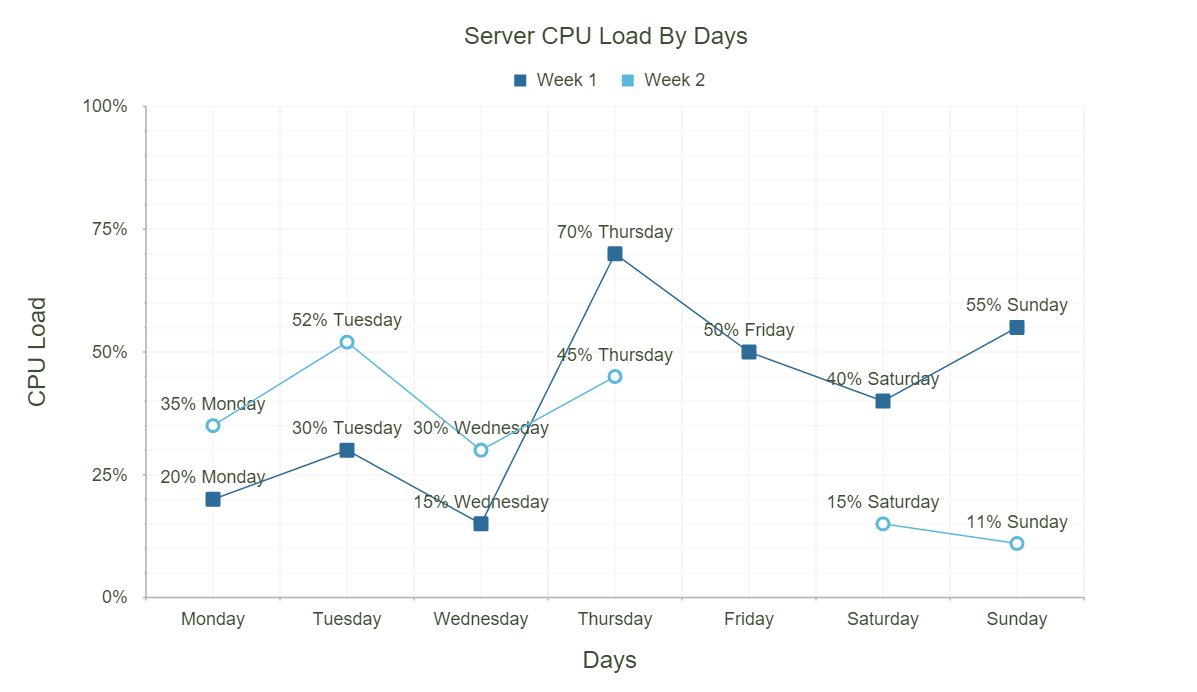
A special scatter chart but added lines between points to highlight the changes betweeen scattered points.
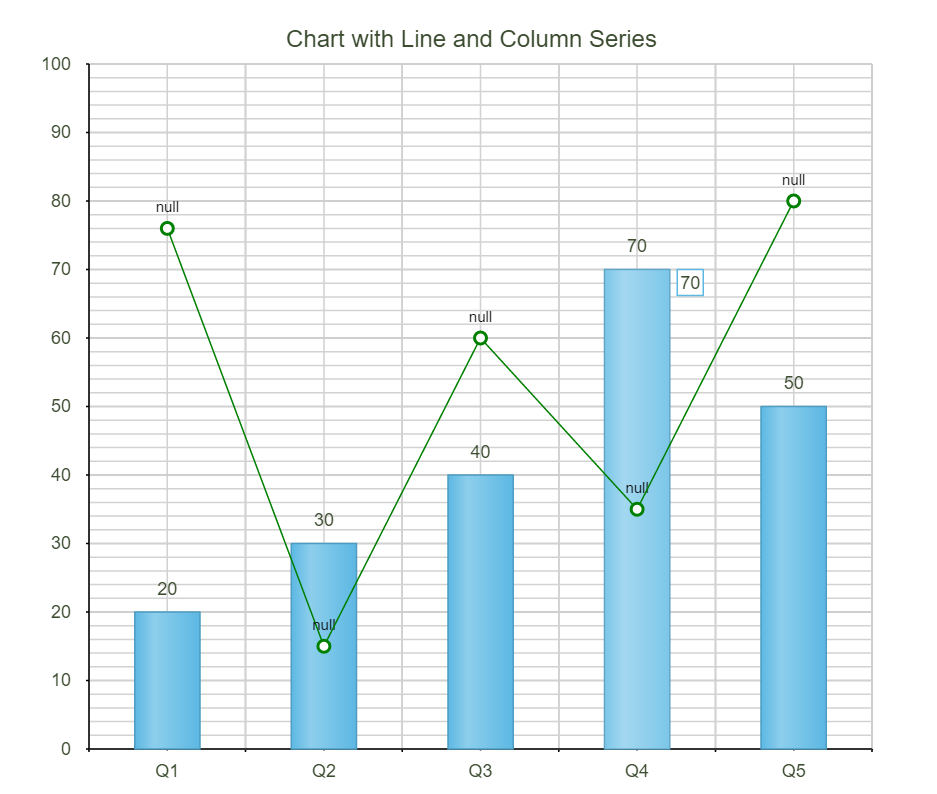
That's awesome that you can even mix several chart types in one chart. It is good to see the whole picture.
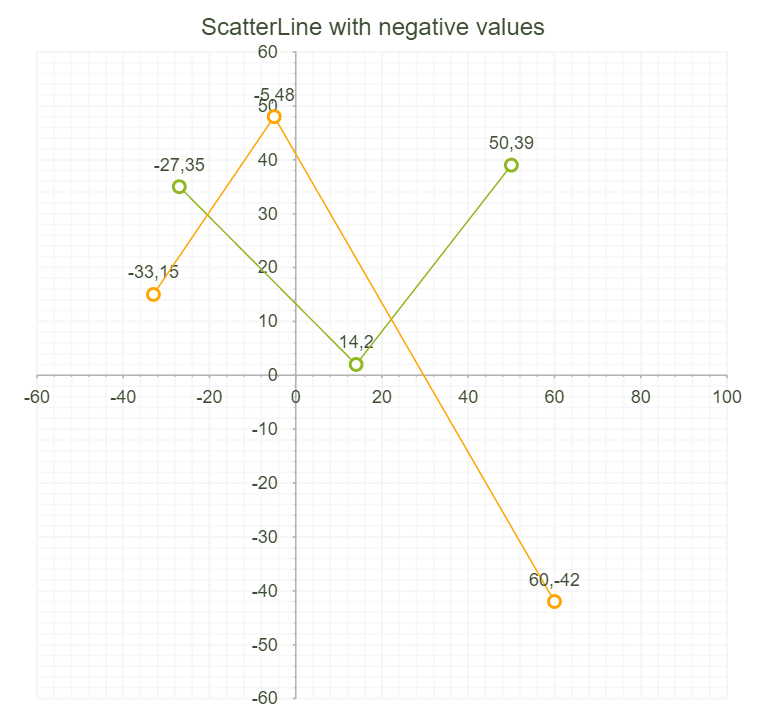
KoolChart is able to handle the negative values. The base line will be moved toward center to spare space for negative direction.
KoolChart is equiped with client-side event. For example, You can track when user hover a particular column then you can show them more regarding information.

What if your users want to save charts for their later reference. You can let them do so with KoolChart. JPEG, PNG or other image types are up to their choice.
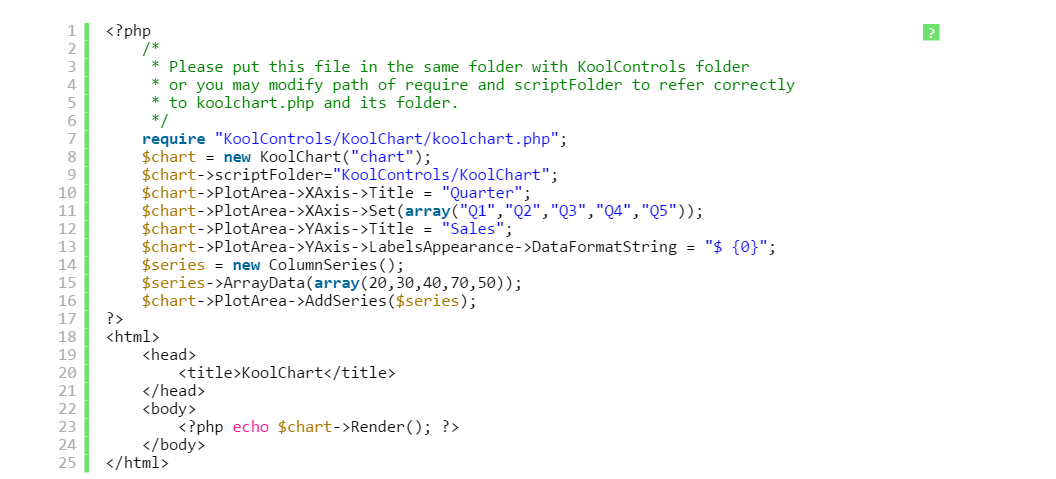
KoolChart is equiped with powerful tool called Code Generator which help you to set up your first code without coding. All you need to do is to copy, paste and modify. Sound good?
The KoolPHP UI contains KoolChart and 20 others cool products for your excellent Web 2.0 application.
I'm very happy customer! Working with alot of thrid-party before, I have never been satisfied like this. Best components, excellent supports!

I just started dreaming about how easy webpages updating and state-saving abilities will change my ideas how to develop php web applications, just as easy as watching a sport game of my favorite team.

Thank you so much for your kindness and your professional support! I will recommend your products to all my web partners!